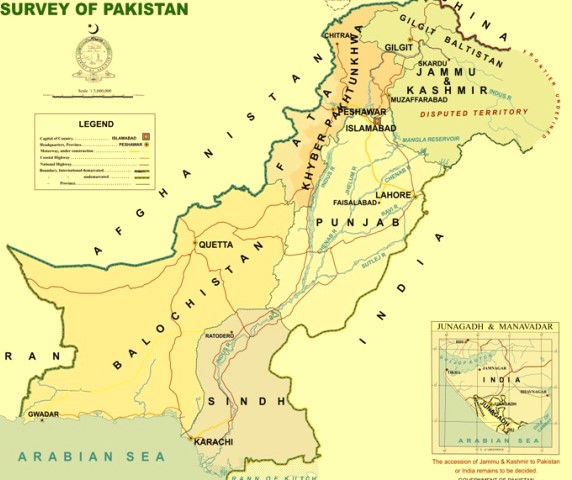
Geography
|
List |
Ranking |
Year |
|
Total Area |
33/196 |
2018 |
|
Irrigated land area |
4/145 |
2016 |
|
Length of coastline |
82/196 |
2018 |
|
Highest Point |
2/241 |
2018 |
|
Mountain peaks over 7,200 meters above sea level |
2nd the world |
2018 |
|
Forest area |
79/193 |
Agriculture
|
Field |
Ranking |
Year |
|
Apricot, 128,382 tons |
7 |
2018 |
|
Cauliflowers and broccoli (212,431 tons) |
- |
2018 |
|
Chickpea, (323,364 tons) |
9 |
2018 |
|
Dates, (471,670 tons) |
6 |
2018 |
|
Fish, output of 151,174 tons |
- |
2015 |
|
Goats, Stock of 74,134,000 Heads |
4 |
2018 |
|
Mangoes, Mangosteens, (2,320,050 tons |
5 |
2018 |
|
Meat (Goat), (333,000 tons) |
3 |
2017 |
|
Milk (as drink) |
4 |
2016 |
|
Milk (Buffalo) 28,109,000 tons |
2 |
2018 |
|
Milk (Goat) (915,000 tons) |
4 |
2018 |
|
Okra, (120,637 tons) |
7 |
2018 |
|
Onion (2,119,675 tons) |
6 |
2018 |
|
Pulses (110,680 tons) |
11 |
2017 |
|
Rice (10,802,949 tons) |
10 |
2018 |
|
Seed Cotton (4,828,439 tons) |
5 |
2018 |
|
Sugar Cane, (67,173,975 tons) |
5 |
2018 |
|
Wheat (25,076,149 tons) |
7 |
2018 |
Demographic
|
List |
Ranking |
Year |
|
Global Terrorism Index |
3/165 |
2018 |
|
Fertility Rate |
40/228 |
2018 |
|
English-speaking population |
3/133 |
|
|
Human Development Index |
149/188 |
2018 |
|
Quality-of-life index |
93/111 |
2005 |
|
Population |
5/238 |
July 2020 |
|
Population growth rate |
45/237 |
2020 |
|
Population Density |
45/215 |
2018 |
|
Life Expectancy at birth |
171/228 |
2020 |
|
Health expenditures |
187/192 |
2016 |
|
Happiness Index |
67/156 |
2019 |
|
Linguistic diversity index |
39/209 |
2009 |
Industry
|
List |
Ranking |
Year |
|
Cement production |
16 in the world |
2014 |
|
Electricity production |
32/209 |
2017 |
|
Hand-sewn footballs production |
1st in the World |
2017 |
|
Surgical instrument manufacturing |
1st in the World |
2017 |
Environment
|
List |
Ranking |
Year |
|
Environmental Sustainability Index |
131/146 |
2005 |
|
36/140 |
2016 |
|
|
Forest area (% of land area) |
185/217 |
2016 |
|
CO2 emissions (kt) |
33/205 |
2014 |
Energy
|
List |
Ranking |
Year |
|
Electricity Production |
31/220 |
2018 |
|
Electricity Installed Generating Capacity |
35/215 |
2016 |
|
Electricity Consumption |
34/219 |
2016 |
|
Electricity From Fossil Fuels |
125/215 |
2016 |
|
22/215 |
2016 |
|
|
Electricity From Hydroelectric Plants |
74/215 |
2016 |
|
Crude Oil Production |
44/217 |
2017 |
|
Crude Oil Imports |
31/218 |
2018 |
|
Crude Oil Proved Reserve |
52/215 |
1 Jan 2018 |
|
Natural Gas Production |
21/217 |
2017 |
|
32/216 |
2017 |
|
|
Natural Gas Proved Reserve |
30/210 |
1 Jan 2018 |
|
Uranium Production |
14/19 |
2018 |
Military
|
List |
Ranking |
Year |
|
Military expenditures |
20/155 |
2016 |
|
Active troops |
6/173 |
|
|
List of countries by number of total troops |
6/173 |
|
|
Size of armed forces |
6th in the world |
|
|
Most active UN peacekeeping force |
3rd in the world |
2019 |
Sports
|
List |
Ranking |
Year |
|
Test Cricket - men's |
7 / 12 |
03 Nov 2019 |
|
ODI Cricket - men's |
6/ 20 |
03 Nov 2019 |
|
T20i Cricket - men's |
1 / 85 |
03 Nov 2019 |
|
Cricket - women's |
7 / 10 |
Sep 2018 |
|
Kabaddi - men's |
3 /10 |
2019 |
|
Number of British Open Squash champions (men) |
1/ 12 |
2019 |
|
Number of World Squash Championships (men) |
1 /150 |
2019 |
|
International Hockey Federation World Rankings (men) |
17 /90 |
2019 |
|
International Hockey Federation World Rankings (women) |
62 /75 |
2019 |
Miscellaneous
|
Description |
Ranking |
Year |
|
Meat Consumption |
33 (12.79 Kgs per person per year) |
2017 |
|
Milk consumption |
8 (183.13 kgs per capita per year) |
2017 |
|
Natural Gas Consumption |
24 /110 |
2017 |
|
Electricity Consumption |
35 /219 |
2016 |
|
Oil Consumption |
35 /210 |
2019 |
|
EF English Proficiency Index |
54 /100 |
|
|
Smart Phone Penetration |
20 |
2019 |


0 Comments
Please do not enter any spam link in the comments box